JJ Highlight Time Ranges with First 5 Minutes and LabelsTo effectively use this Pine Script as a day trader , here’s how the various elements can help you manage trades, track time sessions, and monitor price movements:
Key Components for a Day Trader:
1. First 5-Minute Highlight:
- Purpose: Day traders often rely on the first 5 minutes of the trading session to gauge market sentiment, watch for opening price gaps, or plan entries. This script draws a horizontal line at the high or low of the first 5 minutes, which can act as a key level for the rest of the day.
- How to Use: If the price breaks above or below the first 5-minute line, it can signal momentum. You might enter a long position if the price breaks above the first 5-minute high or a short if it breaks below the first 5-minute low.
2. Session Time Highlights:
- Morning Session (9:15–10:30 AM): The market often shows its strongest price action during the first hour of trading. This session is highlighted in yellow. You can use this highlight to focus on the most volatile period, as this is when large institutional moves tend to occur.
- Afternoon Session (12:30–2:55 PM): The blue highlight helps you track the mid-afternoon session, where liquidity may decrease, and price action can sometimes be choppier. Day traders should be more cautious during this period.
- How to Use: By highlighting these key times, you can:
- Focus on key breakouts during the morning session.
- Be more conservative in your trades during the afternoon, as market volatility may drop.
3. Dynamic Labels:
- Top/Bottom Positioning: The script places labels dynamically based on the selected position (Top or Bottom). This allows you to quickly glance at the session's start and identify where you are in terms of time.
- How to Use: Use these labels to remind yourself when major time segments (morning or afternoon) begin. You can adjust your trading strategy depending on the session, e.g., being more aggressive in the morning and more cautious in the afternoon.
Trading Strategy Suggestions:
1. Momentum Trades:
- After the first 5 minutes, use the high/low of that period to set up breakout trades.
- Long Entry: If the price breaks the high of the first 5 minutes (especially if there's a strong trend).
- Short Entry: If the price breaks the low of the first 5 minutes, signaling a potential downtrend.
2. Session-Based Strategy:
- Morning Session (9:15–10:30 AM):
- Look for strong breakout patterns such as support/resistance levels, moving average crossovers, or candlestick patterns (like engulfing candles or pin bars).
- This is a high liquidity period, making it ideal for executing quick trades.
- Afternoon Session (12:30–2:55 PM):
- The market tends to consolidate or show less volatility. Scalping and mean-reversion strategies work better here.
- Avoid chasing big moves unless you see a clear breakout in either direction.
3. Support and Resistance:
- The first 5-minute high/low often acts as a key support or resistance level for the rest of the day. If the price holds above or below this level, it’s an indication of trend continuation.
4. Breakout Confirmation:
- Look for breakouts from the highlighted session time ranges (e.g., 9:15 AM–10:30 AM or 12:30 PM–2:55 PM).
- If a breakout happens during a key time window, combine that with other technical indicators like volume spikes , RSI , or MACD for confirmation.
---
Example Day Trader Usage:
1. First 5 Minutes Strategy: After the market opens at 9:15 AM, watch the price action for the first 5 minutes. The high and low of these 5 minutes are critical levels. If the price breaks above the high of the first 5 minutes, it might indicate a strong bullish trend for the day. Conversely, breaking below the low may suggest bearish movement.
2. Morning Session: After the first 5 minutes, focus on the **9:15 AM–10:30 AM** window. During this time, look for breakout setups at key support/resistance levels, especially when paired with high volume or momentum indicators. This is when many institutions make large trades, so price action tends to be more volatile and predictable.
3. Afternoon Session: From 12:30 PM–2:55 PM, the market might experience lower volatility, making it ideal for scalping or range-bound strategies. You could look for reversals or fading strategies if the market becomes too quiet.
Conclusion:
As a day trader, you can use this script to:
- Track and react to key price levels during the first 5 minutes.
- Focus on high volatility in the morning session (9:15–10:30 AM) and **be cautious** during the afternoon.
- Use session-based timing to adjust your strategies based on the time of day.
"moving average crossover"に関するスクリプトを検索

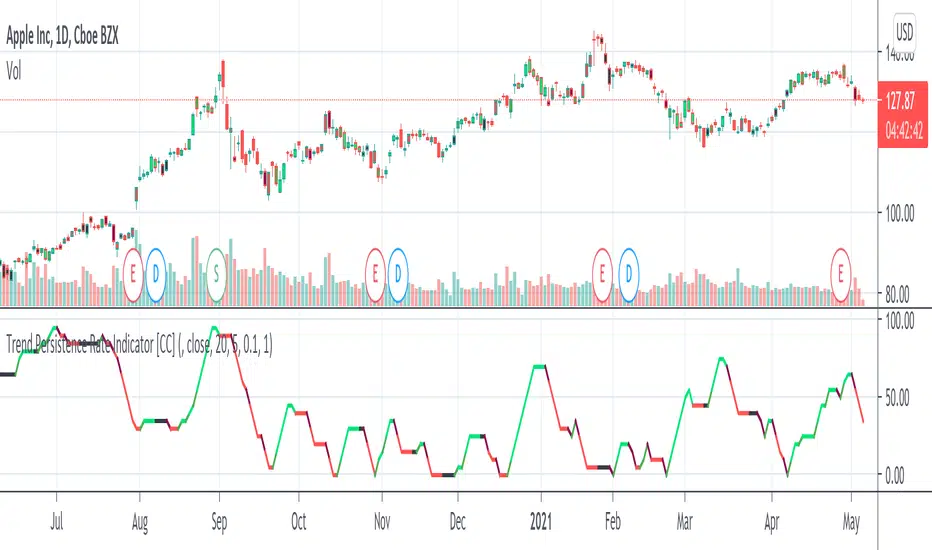
Trend Persistence Rate Indicator [CC]The Trend Persistence Rate Indicator was created by Richard Poster (Stocks and Commodities Feb 2021 pg 12) and this indicator is a good trend strength indicator similar to ADX. A good strategy with this indicator according to the author is to combine this with a moving average crossover strategy and a volatility indicator. Buy when the price crosses over the moving average and when the volatility and this indicator are over a selected minimum. I think 30-40 as a minimum for this indicator works well. Exit that position when this indicator peaks and starts to go down and it should be very profitable for you. I have included general buy and sell signals with this indicator as well.
Let me know if there are any other indicators you would like to see me publish!
Volume Brakeout v1Volume Brakout indicator is used to help determine trend direction strictly based on Negative and Positive volume data.
How to Read:
- Moving Average crossovers are used to help determine a possible trend change or retracement.
- The area cloud on the bottom is calculated by the difference of the moving averages. This could be used to help determine the trending volume strength.
- Bright colored volume bars are large volume spikes calculated by the x factor in the options.
Other changes:
- Volume Depth is going open source with numerous of its indicators. This is only one of many!
- Volume is now displayed without being altered for calculations.

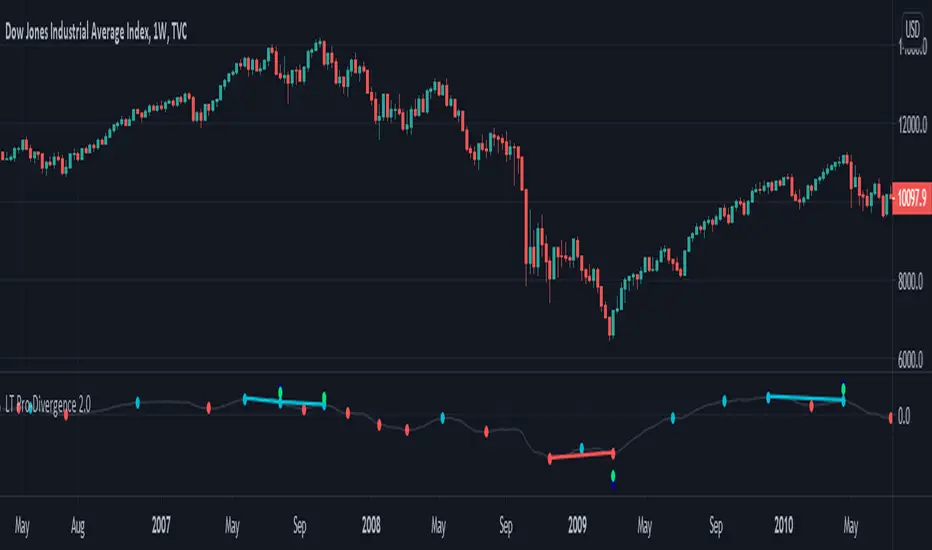
LT Pro-Divergence 2.0This indicator can visually show the divergences on the chart – i.e. a divergence between price action and the momentum. So for example, when price makes a new low and the momentum does not make a new low, this is often a “bullish” divergence – indicating that the force of the downtrend could be weakening. Similarly, when the price makes a new high but the momentum does not make a new high, this is often a “bearish” divergence – indicating that the force of the uptrend could be weakening. Typically, trend reversals are often preceded by a divergence (although it is possible for price to change trend without a prior divergence). We can use divergence as an advance warning of when price may potentially change direction – whether a change in the trend direction or just a correction (or pullback).
It is possible for a divergence to be “negated” – which happens when price continues to move in its direction (i.e. in the direction of the major trend) despite a divergence. So often price can negate a divergence (e.g. a bullish or bearish divergence). This can happen quite a lot in strong trends with momentum.
Due to the numerous divergences that can occur on charts (often with many false signals or whipsaws) – it can be better to use divergence in combination with other technical analysis methods to increase the probabilities. For example, combining divergence with other trend reversal chart techniques such as: trendline breaks, moving average crossovers, break of support or resistance, or oscillators like MACD or RSI etc.
The red divergence colour can indicate a potential bullish divergence, blue divergence colour can indicate a potential bearish divergence. The indicator can also warn of potential divergences developing – so a magenta warning can indicate a potential bullish divergence and a yellow/orange warning of a potential bearish divergence.
The pro divergence indicator incorporates green and blue dots to show when RSI and stochastics is oversold or overbought. The RSI overbought/oversold is shown as dark blue dots – and the stochastics overbought/oversold is shown as green dots. This is added as an extra feature to add further information to the divergence signal. The momentum used in the indicator is the MACD.
The indicator can be used on the charts of the majority of markets (e.g. stocks, indices, ETFs, currencies, cryptocurrencies, precious metals, commodities etc.) and any timeframe. It should be noted that the degree of noise and randomness increases significantly on lower timeframes. So the lower the timeframe that is chosen (e.g. 15-min or lower) the greater the degree of noise and randomness and therefore the higher the frequency of false signals or whipsaws.
Chartists should be aware of the probabilistic and uncertain nature of price action and the markets, and therefore prepare to limit and control any potential risks.
If you would like access, please send me a PM on Tradingview.
LT Pro-Divergence 2.0 ChartThis indicator can visually show the divergences on the chart – i.e. a divergence between price action and the momentum. So for example, when price makes a new low and the momentum does not make a new low, this is often a “bullish” divergence – indicating that the force of the downtrend could be weakening. Similarly, when the price makes a new high but the momentum does not make a new high, this is often a “bearish” divergence – indicating that the force of the uptrend could be weakening. Typically, trend reversals are often preceded by a divergence (although it is possible for price to change trend without a prior divergence). We can use divergence as an advance warning of when price may potentially change direction – whether a change in the trend direction or just a correction (or pullback).
It is possible for a divergence to be “negated” – which happens when price continues to move in its direction (i.e. in the direction of the major trend) despite a divergence. So often price can negate a divergence (e.g. a bullish or bearish divergence). This can happen quite a lot in strong trends with momentum.
Due to the numerous divergences that can occur on charts (often with many false signals or whipsaws) – it can be better to use divergence in combination with other technical analysis methods to increase the probabilities. For example, combining divergence with other trend reversal chart techniques such as: trendline breaks, moving average crossovers, break of support or resistance, or oscillators like MACD or RSI etc.
The red divergence colour can indicate a potential bullish divergence, blue divergence colour can indicate a potential bearish divergence. The indicator can also warn of potential divergences developing – so a magenta warning can indicate a potential bullish divergence and a yellow/orange warning of a potential bearish divergence.
The pro divergence indicator incorporates green and blue dots to show when RSI and stochastics is oversold or overbought. The RSI overbought/oversold is shown as dark blue dots – and the stochastics overbought/oversold is shown as green dots. This is added as an extra feature to add further information to the divergence signal. The momentum used in the indicator is the MACD.
The indicator can be used on the charts of the majority of markets (e.g. stocks, indices, ETFs, currencies, cryptocurrencies, precious metals, commodities etc.) and any timeframe. It should be noted that the degree of noise and randomness increases significantly on lower timeframes. So the lower the timeframe that is chosen (e.g. 15-min or lower) the greater the degree of noise and randomness and therefore the higher the frequency of false signals or whipsaws.
Chartists should be aware of the probabilistic and uncertain nature of price action and the markets, and therefore prepare to limit and control any potential risks.
If you would like access, please send me a PM on Tradingview.

Vicious Cycle 1.2 [CR] - Enhanced█ OVERVIEW
Vicious Cycle 1.2 is an advanced oscillator-based momentum indicator designed to identify high-probability reversal and continuation setups. This new version features adaptive threshold technology, visual trend state classification, and a higher timeframe alignment system to filter low-quality signals.
The indicator analyzes multiple timeframe components and market dynamics to generate a composite momentum score, which is then smoothed and compared against statistical thresholds. Unlike traditional static oscillators, Vicious Cycle adapts its sensitivity zones to current market conditions, reducing false signals during volatile periods and increasing responsiveness during consolidation.
█ FEATURES
Adaptive Threshold System
The indicator employs percentile-based threshold calculations that automatically adjust to recent market behavior. This ensures optimal signal generation across different instruments and market regimes without manual recalibration.
• Toggle between dynamic and fixed threshold modes
• Adjustable lookback period for threshold calculation (50-500 bars)
• Customizable percentile levels for sensitivity tuning
• Separate calibration for overbought and oversold zones
Visual Trend State Classification
Background coloring provides instant visual feedback on market condition strength without requiring analysis of indicator position. The six-state classification system combines oscillator position with signal line relationship to identify:
• Strong bullish momentum
• Moderate bullish bias
• Weak bullish condition
• Weak bearish condition
• Moderate bearish bias
• Strong bearish momentum
Higher Timeframe Trend Alignment
An optional filtering system analyzes higher timeframe trend direction to block counter-trend signals. Two modes are available:
• Single EMA Mode: Uses price position relative to a customizable moving average
• Dual EMA Mode: Employs fast and slow moving average crossover logic
The filter only permits long signals during bullish trends and short signals during bearish trends, significantly improving signal quality in trending markets.
Signal Detection Modes
Multiple signal generation methods accommodate different trading styles:
• Zone-Based Signals: Fires when oscillator crosses key threshold levels
• Signal Line Cross: Generates entries based on oscillator and signal line interaction
Comprehensive Alert System
Pre-configured alert conditions cover all major indicator events:
• Primary signal alerts (zone cross and signal line methods)
• Zone entry and exit warnings
• Extreme level notifications
• Trend filter status changes
• Convenience aggregators for "any long" or "any short" condition
█ HOW TO USE
Initial Configuration
The indicator ships with optimized default settings suitable for most instruments and timeframes. New users should observe the indicator's behavior for at least 50 signals before adjusting parameters.
1 — Add the indicator to your chart and leave default settings unchanged.
2 — Monitor signal generation and background color transitions for several trading sessions.
3 — Set up basic alerts using the "ANY LONG Signal" and "ANY SHORT Signal" conditions.
4 — After observation period, adjust sensitivity based on your instrument's characteristics.
Threshold Configuration
For instruments with higher volatility, increase the percentile values (example: 90/75 instead of 85/65). For ranging or lower volatility instruments, decrease percentile values (example: 80/60 or 75/55).
The lookback period controls how quickly thresholds adapt to changing conditions. Longer lookbacks (150-200) provide smoother adaptation, while shorter lookbacks (50-75) offer more responsive adjustments.
Trend Filter Guidelines
Enable the trend filter in clearly trending markets to reduce whipsaw trades. In ranging or choppy conditions, consider disabling the filter or using a shorter EMA period.
• For position trading: Use 200-period single EMA
• For swing trading: Use 150-period single EMA or 50/200 dual EMA
• For day trading: Use 100-period single EMA or 50/100 dual EMA
If the filter blocks all signals, the market may be ranging near the trend reference level. This is intentional behavior designed to keep you out of low-probability setups.
Signal Interpretation
Primary signals occur when the oscillator crosses threshold zones or intersects the signal line in extreme regions. The strongest setups combine:
• Signal generation in the expected direction
• Background color matching the trade direction (bright colors indicate high conviction)
• Trend filter alignment
• Price action confirmation at key support or resistance levels
█ NOTES
Alert Configuration
Alerts must be manually configured in TradingView and do not activate automatically. Access the alert menu by clicking the indicator name and selecting "Add Alert on Vicious Cycle 1.2...". Choose your desired condition from the dropdown menu and configure notification preferences.
We recommend starting with the aggregated "ANY" alerts rather than subscribing to all individual signal types, as this prevents notification overload during active market periods.
Dynamic Threshold Behavior
The adaptive threshold system requires sufficient historical data (minimum equal to the lookback period setting) to calculate percentiles accurately. During the initial bars, threshold values may appear unusual until adequate history accumulates. This is expected behavior and resolves automatically.
Performance Considerations
The indicator performs percentile calculations on each bar using array operations. While optimized for efficiency, users experiencing performance issues on lower-end devices may reduce the dynamic lookback period or disable the adaptive threshold feature to use fixed thresholds instead.
Compatibility
Vicious Cycle 1.2 is built on Pine Script version 6 and works on all instrument types and timeframes. The indicator does not repaint—all signals finalize at bar close. Historical signals remain stable and do not change with additional price data.
█ RISK DISCLOSURE
This indicator is an analytical tool and does not constitute financial advice. No indicator or trading system guarantees profitable results. Always employ proper risk management, position sizing, and stop-loss protocols. Past performance does not indicate future results. Users are responsible for their own trading decisions and outcomes.

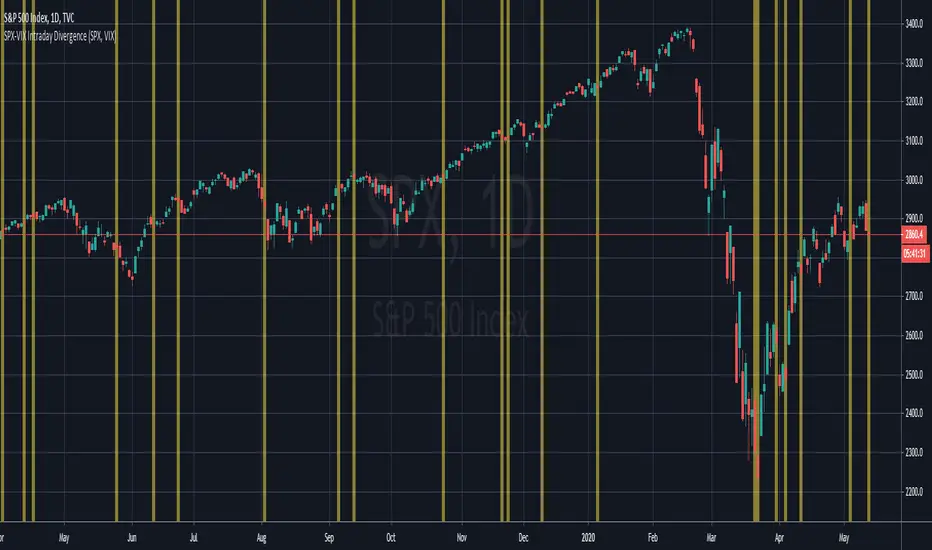
SPX-VIX Intraday DivergenceAs a long-term buyer/short-seller, you will always find different ways to enter the market , moving average crossovers, breakouts , overbought/oversold conditions being some of the classy methods. However, they are decreasingly effective... 😢
Recently I have realized that analysis beyond the technical indicators will bring trading to the next level because I will be able to confirm my trading signals without relying too much on basic price actions and patterns which are easily manipulated by big banks and institutions. 👍
Today I will introduce you to my divergence indicator making use of SPX and VIX. Unlike MacD or RSI divegence , which would involve normative judgement , it will take account of the unusual move by SPX alongwith the VIX , to the exploit chances that options market, where most experienced investors participated in has a preceding insight into the equity market about the upcoming moves.
I have divided signals into two groups.
Bullish divergence - SPX Down , VIX also Down 👇
Bearish divergence - SPX Up , VIX also Up 👆
I hope this script will enable us to take advantage of the options market activities , to provide a REAL divergence signal, and be used coupled with our own chart patterns or other price signals, and more importantly to score more and more winning trades!!!
If you want more useful scripts from me, please like and share my posts. And don't forget to follow my account to grab the latest ideas and tools! 😘
Lowkey System (Study)View strategy version
A long-only strategy that aim to detect the beginning of new bullish trends and their ends.
For entering a new position this script is waiting for a moving average crossover then wait for a volume increase relative to the current volatility.
For closing a position it's simply waiting for a crossunder of whether the MA or if enabled the stop loss.
This strategy is already configured to run on BTCUSD in a 4h timeframe but you can customize the moving average and the stop loss parameters to suit your needs.
I've worked a lot to write this script so I'm not giving it for free but you can try it for 10 days.
Contact me for more details.
Have fun!
PS: I'm french so please excuse me if I've made some grammar errors ;)

unRekt - The MachineThis is a combined script of Welcome to the Machine and Kiss Cross. A moving average crossover was added with the golden cross '50 n 200' being most noticeable.
Up to 5 editable moving averages can be selected on their own or all displayed with varying type of your choice SMA, EMA, WMA, VWMA and LSMA.
Bollinger bands can be disabled to just show the moving average.
Image of bollinger bands off:

Volume Flow v3DepthHouse Volume Flow indicator is used to help determine trend direction strictly based on Negative and Positive volume data.
How to Read:
- Moving Average crossovers are used to help determine a possible trend change or retracement.
- The area cloud on the bottom is calculated by the difference of the moving averages. This could be used to help determine the trending volume strength.
- Bright colored volume bars are large volume spikes calculated by the x factor in the options.
Other changes:
- DepthHouse is going open source with numerous of its indicators. This is only one of many!
- Volume is now displayed without being altered for calculations.

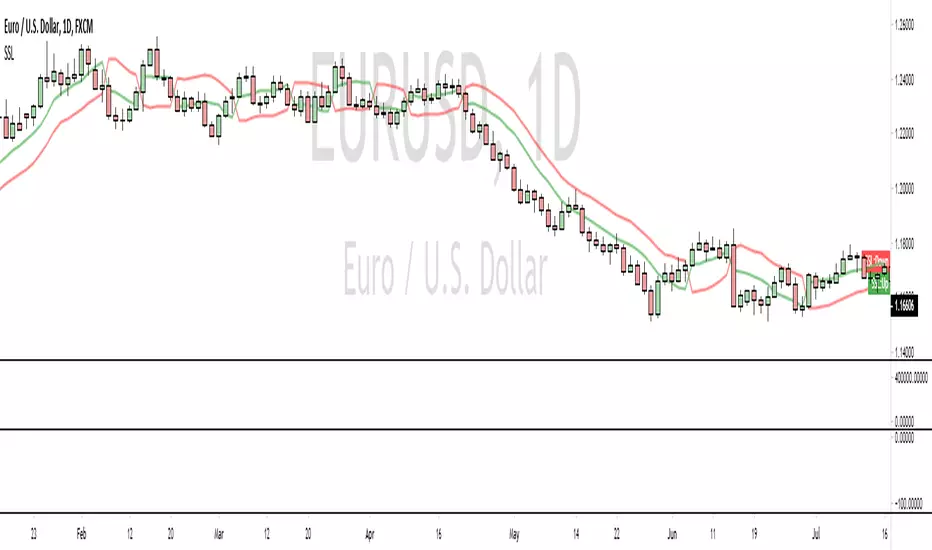
SSL [dasanc]The SSL is a fair entry condition and good exit indicator. It works best when combined with a trend indicator and multiple confirmations.
In essence, the SSL is a moving average crossover, which immediately down-grades it to a 2nd or 3rd level of confluence in my opinion.
It was recently featured in an episode of VP's "No Nonsense FX", which drove me to recreate the original MT4 indicator in PineScript.
I have two ideas on how to improve it -
Use a much faster moving average calculation method (check out my Ehlers scripts)
Use a longer period MA on lower timeframes
If you enjoy/use this script, drop me a follow and please note me in your code!
I'm *almost* always available for collabs and questions
(JS) Moving Average Secuirty OscillatorThis is kind of like the Moving Average Crossover Oscillator - except this measures in % the distance between the security you're charting and the MA you have entered in.
The goal is to see when the price pulls too far from the MA.
Hope you like it!


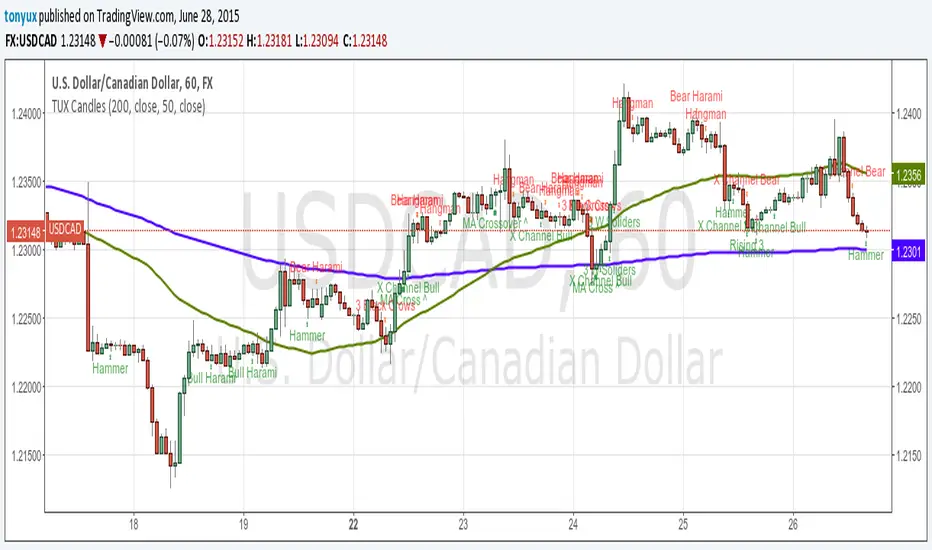
TUX CandlesThis indicator has a lot of information. This is the first version so stay tuned for updates, and please let me know of any bugs.
Candlestick Indicators:
Doji
Shooting Star
Evening Star
Hammer
Hanging Man
Candlestick Formations
Tri-star
Bearish Harami
Bullish Harami
Bearish Harami Cross
Bullish Harami Cross
Bullish Engulfing
Bearish Engulfing
Rising Three
Falling Three
Bearish Abandoned Baby
Bullish Abandoned Baby
Three Black Crows
Three White Soldiers
Technical Indicators:
(You can set you MA periods)
Moving Average Cross
Move Average Crossover
NEURAL FLOW | The AI-Powered Regime Classifier [by @Ash_TheTrade📉 Stop Trading Blindly. Filter the Noise with AI.
Why do your favorite strategies work perfectly one week and bleed your account the next?
The answer is simple: Context.
A Moving Average crossover works in a trend but gets slaughtered in chop. RSI works in a range but fails in a strong breakout. Most indicators are "dumb"—they apply the same math regardless of the market's current reality.
I created Neural Flow to fix this.
Developed by @Ash_TheTrader, this isn't just another buy/sell arrow indicator. It is a sophisticated market Regime Classifier built on concepts derived from machine learning (Lorentzian Distance algorithms).
It doesn't just tell you where price is; it tells you what the market is doing.
🧠 The Concept: How It Works
The core idea behind this script is simple yet powerful: Don't trade unless the environment is right.
The Neural Flow algorithm acts like a veteran trader watching over your shoulder. It analyzes multiple "neurons" (data points representing momentum, volatility, and cyclicality) and compares the current price action to historical data.
By identifying what "state" the market is currently in, it paints your chart in real-time, acting as the ultimate filter for any strategy you use.
👁️ The 4 Market Regimes
The indicator instantly classifies the market into one of four distinct states, visualizing them with a full-chart background glow and candle painting:
1. 🐂 Bull Trend (Neon Green)
The market has clear upward momentum, healthy RSI, and strong trend orientation.
Action: Look for Long entries. Buy dips.
2. 🐻 Bear Trend (Neon Red)
The market has clear downward momentum and weak underlying metrics.
Action: Look for Short entries. Sell rallies.
3. 🚫 CHOP (Grey/Monochrome)
This is the most important feature. The AI has detected low volatility squeeze conditions or directionless ADX. This is where 80% of traders lose money due to fake-outs and whipsaws.
Action: DO NOT TRADE. Sit on your hands and preserve capital.
4. ⚡ Breakout Detected (Gold/Yellow)
The algorithm has detected a sudden, violent expansion in volatility (Bollinger Width explosion) following a period of chop. The direction is not yet confirmed, but a big move is imminent.
Action: Get ready. Watch for a transition into a Bull or Bear regime.
💻 The Glassmorphism Dashboard & AI Confidence
In the corner of your chart, you will find a futuristic, transparent "Glass UI" dashboard designed by @Ash_TheTrader.
It provides instant situational awareness without cluttering your view.
The AI Confidence Score:
This is your conviction meter. It calculates how aligned the various "neurons" of the algorithm are (ranging from 0% to 100%).
A Bull Trend with 40% Confidence might be weak and prone to reversal.
A Bull Trend with 85%+ Confidence indicates strong confluence across multiple data points.
Pro Tip from @Ash_TheTrader: Only take trades when the AI Confidence is above 75%.
🚀 How to Use This in Your Trading
This tool is designed to be versatile.
As a Strategy Filter (Recommended): Use your existing favorite strategy (e.g., MACD, SMC, Price Action). Before taking a trade, glance at the Neural Flow background.
Your strategy says Buy, but the background is Grey (Chop)? Skip the trade.
Your strategy says Sell, and the background is Red (Bear)? Take the trade with confidence.
As a Standalone System: Wait for the market to transition out of "Grey Chop" into a "Green Bull" or "Red Bear" regime. Confirm that the "AI Confidence" on the dashboard is high (>70%), and enter in the direction of the new trend.
⚙️ Settings & Customization
While the default settings are tuned for most markets, @Ash_TheTrader believes in flexibility:
Training Window: Adjust the sensitivity of the regime detection.
Visuals: Customize all colors to match your chart aesthetic.
Glass Dashboard: Move it, resize it, or turn it off completely.
Baseline EMA: Toggle the 50-period baseline reference line on or off to keep your charts ultra-clean.
A Note from the Author:
"Trading isn't about catching every move; it's about catching the right moves and staying safe during the noise. I built this tool to help me instantly recognize when to step on the gas and when to hit the brakes. I hope it brings clarity to your charts."
— @Ash_TheTrader
Disclaimer: This tool is for informational purposes only and does not constitute financial advice. Always manage your risk.

Dual MA Crossover with Profit Targets + Stop-LossChatGPT script and is a dual moving average crossover script with profit targets and stop loss

Nick2k Trend Tracker MT botNick2k Trend Tracker MT bot
Type: Indicator (signals + PineConnector alerts for EAs)
Markets: Designed for XAUUSD (gold), adaptable to other symbols
Timeframes: Optimized for M5/M15
---
What it does
Nick2k Trend Tracker MT bot identifies trend flips using a percentile-normalized SMA slope with hysteresis, then applies a multi-layer filter suite to avoid false signals in low-quality conditions.
It can optionally auto-manage trades via PineConnector:
Send open orders with SL/TP (ATR- or pip-based)
Breakeven activation
Dual trailing stops (pip-based or ATR-based)
Staged partial closes (up to 3 levels)
The indicator also:
Highlights chop zones in the background
Provides diagnostic labels showing which filters passed/failed
Lets you disable all alerts with one checkbox (visual testing mode)
---
Core logic (simplified)
Trend Engine: SMA slope normalized by a rolling percentile; flips with hysteresis at +0.1/–0.1.
Filters: optional checks for slope strength, ADX, narrow range ratio, ATR squeeze, higher-timeframe slope.
Sessions: entry/management can be gated to London, NY, Tokyo, Sydney sessions and weekdays.
Chop highlight: background shading when ranges/low-volatility are detected for consecutive bars.
---
Visuals
Colored SMA line (gradient by slope)
BUY/SELL labels at valid flip bars
Chop background (yellow overlay)
Filter score/diagnostic label (optional)
---
Alerts & PineConnector integration
Open orders: sent at valid BUY/SELL flips with embedded SL/TP + BE/trailing if enabled
Partial closes: 3 configurable milestones (ATR or pip based, % or fixed lots)
Master toggle: switch all alerts ON/OFF instantly
Alerts are formatted in PineConnector EA syntax for compatibility with MetaTrader auto-trading.
---
Inputs (organized by group)
SMA & Theme (length, colors)
Auto Trading (license, symbol, lots, master toggle)
SL/TP Target Type (prices vs pips)
ATR SL/TP (length, multipliers, rounding)
Breakeven (trigger/offset)
Pip Trailing (trigger/dist/step)
ATR Trailing (TF, period, multiplier, trigger)
Partial Closes (mode, lots or %)
Time Filters (sessions, weekdays)
Filters (Slope, ADX, NRR, ATR squeeze, HTF confirm)
Chop Zone Highlight (on/off, hold bars, color)
---
Why this script is unique (and closed-source)
This is not a simple moving-average crossover. It combines several custom-built methods that are rarely seen in public scripts:
Normalized SMA slope with hysteresis: avoids whipsaws, adapts to volatility regimes.
Multi-filter confirmation: ADX, NRR, ATR squeeze, HTF slope — stacked to improve quality.
Chop detection with persistence: custom counter/hold logic to highlight ranging markets.
Integrated trade management: PineConnector-ready messages with SL/TP, breakeven, dual trailing stops, staged partial closes.
EA-compatible syntax: formatted exactly for PineConnector EAs, including safety toggles.
This represents a full trading framework designed for semi-automated gold scalping, not just a “signal indicator.”
The source is protected to prevent clones and preserve development effort invested in unique logic and PineConnector integration.
---
Recommended starting settings (XAUUSD M5/M15)
Pip size: 0.10
Slope threshold: 0.20 (M5), 0.16–0.20 (M15)
ADX min: 18–22
NRR floor: 2.0–2.4
ATR ratio: 0.65–0.75
ATR SL/TP: SL = 1.5×ATR, TP = 2.5×ATR
Sessions: London & NY
---
Limitations & disclaimer
Not financial advice. Test on demo before live trading.
Performance depends on broker symbols, spread, and volatility regime.
Auto-trading requires PineConnector EA set up correctly.
---
Changelog
v1.0 – Initial release (trend engine, filters, sessions, chop highlight, PineConnector alerts, BE/trailing, partial closes, diagnostics)

Dr. Keith Wade Momentum SignalsThis is a heikin Ashli strategy combined with an 18 moving average crossover. Entry at cross of 18 EMA and exit at change of heikin Ashi

Smoothed Relative Volatility Index W/2 EMAThis script is a reboot of the relative volatility index that adds a smoothing factor to the indicator which eliminates a significant amount of the noise/signal ratio.
The relative volatility index is defined as the following from tradingism.com:
"Relative Volatility Index Definition
The relative volatility index (RVI) was developed by Donald Dorsey, who truly understood that an indicator is not the holy grail of trading. The RVI is identical to the relative strength index , except it measures the standard deviation of high and low prices over a defined range of periods. The RVI can range from 0 to 100 and unlike many indicators that measure price movement, the RVI does an exceptional job of measuring market strength.
Purpose of Relative Volatility Index
The relative volatility index was designed not as a standalone indicator, but as a confirmation for trading signals. The RVI is most widely used in conjunction with moving average crossover signals."
The rules of the RVI are to sell below the 50 line and buy above the 50 line. The 2 EMA's I added act as a "dynamic" 50 line and also provide crossover signals.
The smoothed relative volatility index included, is accompanied by the original relative volatility index as an option with its own EMA's.
The smoothing factor provides divergence signals and/or an added layer of confirmation from other indicators.
On the chart above is the smoothed relative volatility index above the original set to the same time period for comparison.

Buying vs Selling PowerThis is a simple script that can help identify buying and selling pressure over a period of time.
This is a great addition to any strategy to help confirm direction and strength. You can accompany this indicator with something as simple as a moving average crossover or MACD crossover to help with confirmation of the signal as you want to trade in the direction of volume.

JM Momentum Moving Average CrossoverReuploaded.
Some people complained about noisy signals from previous gainzy inspired intraday indicator so have designed this one to be more robust. Is pretty good at capturing early trend changes in momentum. Have not backtested yet. Recommended for lower time frames, 1 hour and under, I like 45m.
How it works?
____________
Using custom fast and slow momentum factors it is simply a crossover of the two.
How to use?
____________
Wait for closing bar, if BUY signal is printed, momentum is trending upwards so longs are favoured. If SELL signal is printed, shorts are favored.


Triple Moving Average Crossover IndicatorGo Long as the fastMA crosses above the slowMA (All Green Fill)
Go Short as the fastMA crosses below and other MA (Red)
Prep for next movement when the fill colours are mixed together.
Back this up with volume and momentum indicators.
I'm currently working on turning this into a strategy.
Please let me know what you think, as this is my first indicator.
